Exclusive Research-Critical Trends
- Published: May 01, 2011, By By Yolanda Simonsis, Editor/Associate Publisher
Good results were reported in practically every business activity in the following sectors: flexible packaging; unprinted rolls & sheets labels, tapes & tags; and paperboard packaging. While bad news comes in the form of continuing increases in materials costs, in 2010 converters offset this negative trend with positive growth in profits, revenue, hiring, volume of orders, inquiry activity, and business backlog to name just a few. This year's survey was e-mailed January 11-28, with the number of qualified respondents continuing to grow, providing a more accurate picture of industry trends. Particularly encouraging are converters' investments in R&D to attract customers in search of innovative products — the lifeblood of our industry.
†Survey sent to effective mailing of 14,507 recipients. Qualified returned surveys from only converters (no suppliers or equipment manufacturers) numbered at 347.
*PFFC has recorded these trends since 2006. Visit www.pffc-online.com/special_reports for responses to past “Critical Trends” surveys.
Primary Business
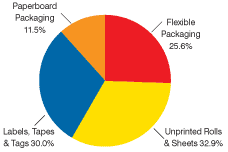
One-third of respondents (33%) are employed in unprinted rolls & sheets; 30% in labels, tapes & tags; 26% in flexible packaging; and 12% in paperboard packaging. The typical respondent works for a company with an estimated median 75 employees.
Expectations for Business Activities: 2009 to 2011
*Visit www.pffc-online.com/special_reports/ for charts that specifically break out these responses.
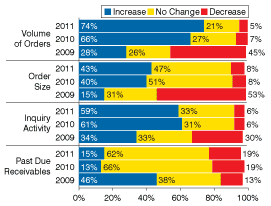
Most respondents expect to enjoy improved business conditions, particularly in terms of volume of orders (74%) and inquiry activity (59%). The majority of respondents expect past due receivables to remain stable in 2011.
Business Activities: 2008 to 2010
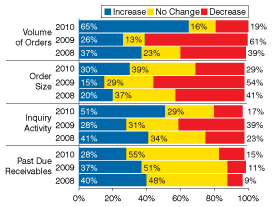
Conditions improved in 2010 for all business activities addressed. The greatest improvements were seen in volume of orders (65% reporting an increase in 2010) and inquiry activity (51% reporting an increase).
Custom Research
Penton Media can customize a research study just for you. Our team of highly accredited experts is experienced in specific industry sector research. Our expertise is backed by a proprietary database of more than 3 million business-to-business names. For more information visit www.penton.com.
Change in Financial Indicators
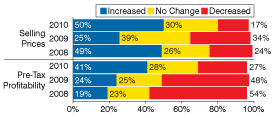
Financial indicators showed marked improvement in 2010 as well. Half of respondents reported increased selling prices in 2010, and 41% reported increased pre-tax profitability.
Change in Customers' Revenue & Profitability
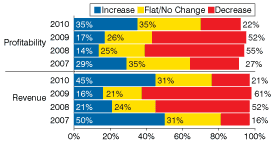
Dramatic losses in both customer revenue and profitability of the past two years came to an end in 2010. A third of respondents (35%) indicated an increase in customer profitability in 2010, and 45% indicated increased customer revenue.
Materials Costs
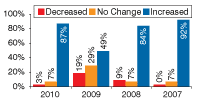
The majority of respondents reported increased materials costs. While the percent of respondents reporting increases rose dramatically, the mean amount of increase remained stable. (However, this survey preceded Middle East tensions.) An estimated mean increase of 7.0% was reported.
Business Impact of Imported Converted Products

The impact of imported products has remained stable over the past three years. For those negatively impacted in 2010, sales revenue was down an average 13%, and profit margin was down an average 9%. Converted products negatively impacting respondent businesses were most likely to have been imported from China (85%), followed by Mexico (28%), and other Asian countries (23%). Only 17% of respondent companies have partnered with a company outside the US to produce converted products. Another 8% have plans to do so.

-
From where were these products imported?
| China | 85.0% |
| Mexico | 27.7% |
| Other Asia | 23.1% |
| India | 16.9% |
| Canada | 10.8% |
| Other Pacific Rim | 10.8% |
| South America | 10.0% |
| Western Europe | 10.0% |
| Eastern Europe | 4.6% |
| Middle East | 3.8% |
Change in Employment
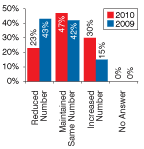
The staffing reductions of the past two years appear to have come to an end in 2010. Almost half of respondents (47%) reported maintaining staffing levels in 2010. An additional 30% increased the total number of employees. This welcome news follows two consecutive years of significant reductions in staffing (43% reported reductions in 2009, 38% in 2008).
Employment numbers overall held steady, with an average employment change of 0.5%. This significant improvement follows an average 8% decrease in 2009 and a 3% decrease in 2008. Further, 41% of respondents reported increasing spending on employee benefits in 2010. Just 13% reported reduced spending in this area. Respondents expect similar levels of change in 2011.
Impact of the Economic Crisis
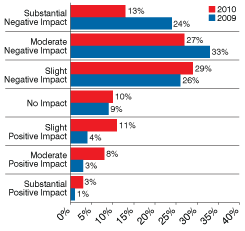
Half of all respondents said the economic crisis had a negative impact. This is a improvement over 2009, when 83% of respondents reported a negative impact.
Change in Revenue: 2009 to 2010
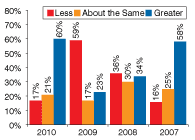
Sales revenue showed dramatic recovery in 2010. Over half of all respondents (60%) reported increased sales revenue in 2010. This is marked improvement over 2009, when the same percentage indicated decreased sales revenue. Respondents reported an average increase of 7.1% in 2010 versus the 9% decrease reported in 2009.
Impact of Sustainability Efforts on Sales
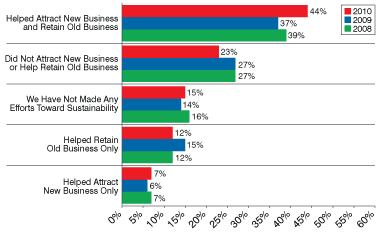
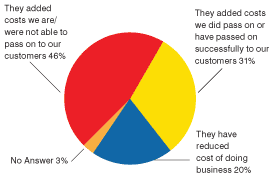
Sustainability efforts continued to attract and retain business in 2010. However, these efforts also continue to add costs for the majority of respondents. While 31% were able to pass those costs on to their customers, 46% had to absorb them.
New or Expanded Service Offerings in 2010
The vast majority of respondents (82%) plan to add or expand product/service offerings in 2011. As in prior years, respondents are most likely to expand their printing (35%) capabilities, followed by laminating (26%), coating (25%), and/or slitting (21%) capabilities. Half of all respondents (54%) reported making significant (defined as more than $30,000) capital investments in 2010, and 55% plan to do so within the next 6-12 months.
Plant Capacity Utilization
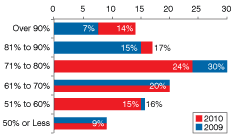
Plant capacity utilization increased for half of all respondents in the last half of 2010. Overall plant capacity utilization was an estimated mean 70% in 2010 as in 2009; however, it's notable that those operating at 90% doubled over 2009.
Business Backlog
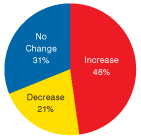
Only 21% reported a decrease in business backlog for the last half of 2010, compared to 31% in 2009 and 62% in 2008.
Most Profitable Company Investment
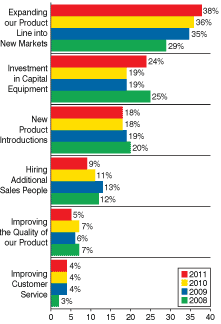
Expanding product line into new markets is still considered the best investment. Investment in capital equipment is up slightly (5%) in 2010.
Research & Development

While investments in R&D largely remained stable in 2010, 30% reported an increase in these activities, with only 4% indicating a decrease as compared to 12% in 2009..


